A tool to support the decision making process for surveillance and vector control of dengue, chikungunya and Zika virus disease in Europe
Tool source directory:
Description
This tool comprises of a compartmental stochastic model at a population-scale, which is based on three different components: entomological dynamics, transmission dynamics in the human population, and (optionally) spatial dynamics. Mosquitoes and humans reside in patches where their respective densities are assumed to be homogeneous. Humans may move between patches, propagating viruses spatially if infected or infectious. The mosquito dynamics is rainfall and temperature driven, and the transmission is temperature driven. The user may experiment with vector control affecting immature or mature mosquito stages, and vary virus importation in humans.
Download the model code
For experienced R users who want to run the model on their own computers, the R code of this shiny app is made available for download.
Workflow
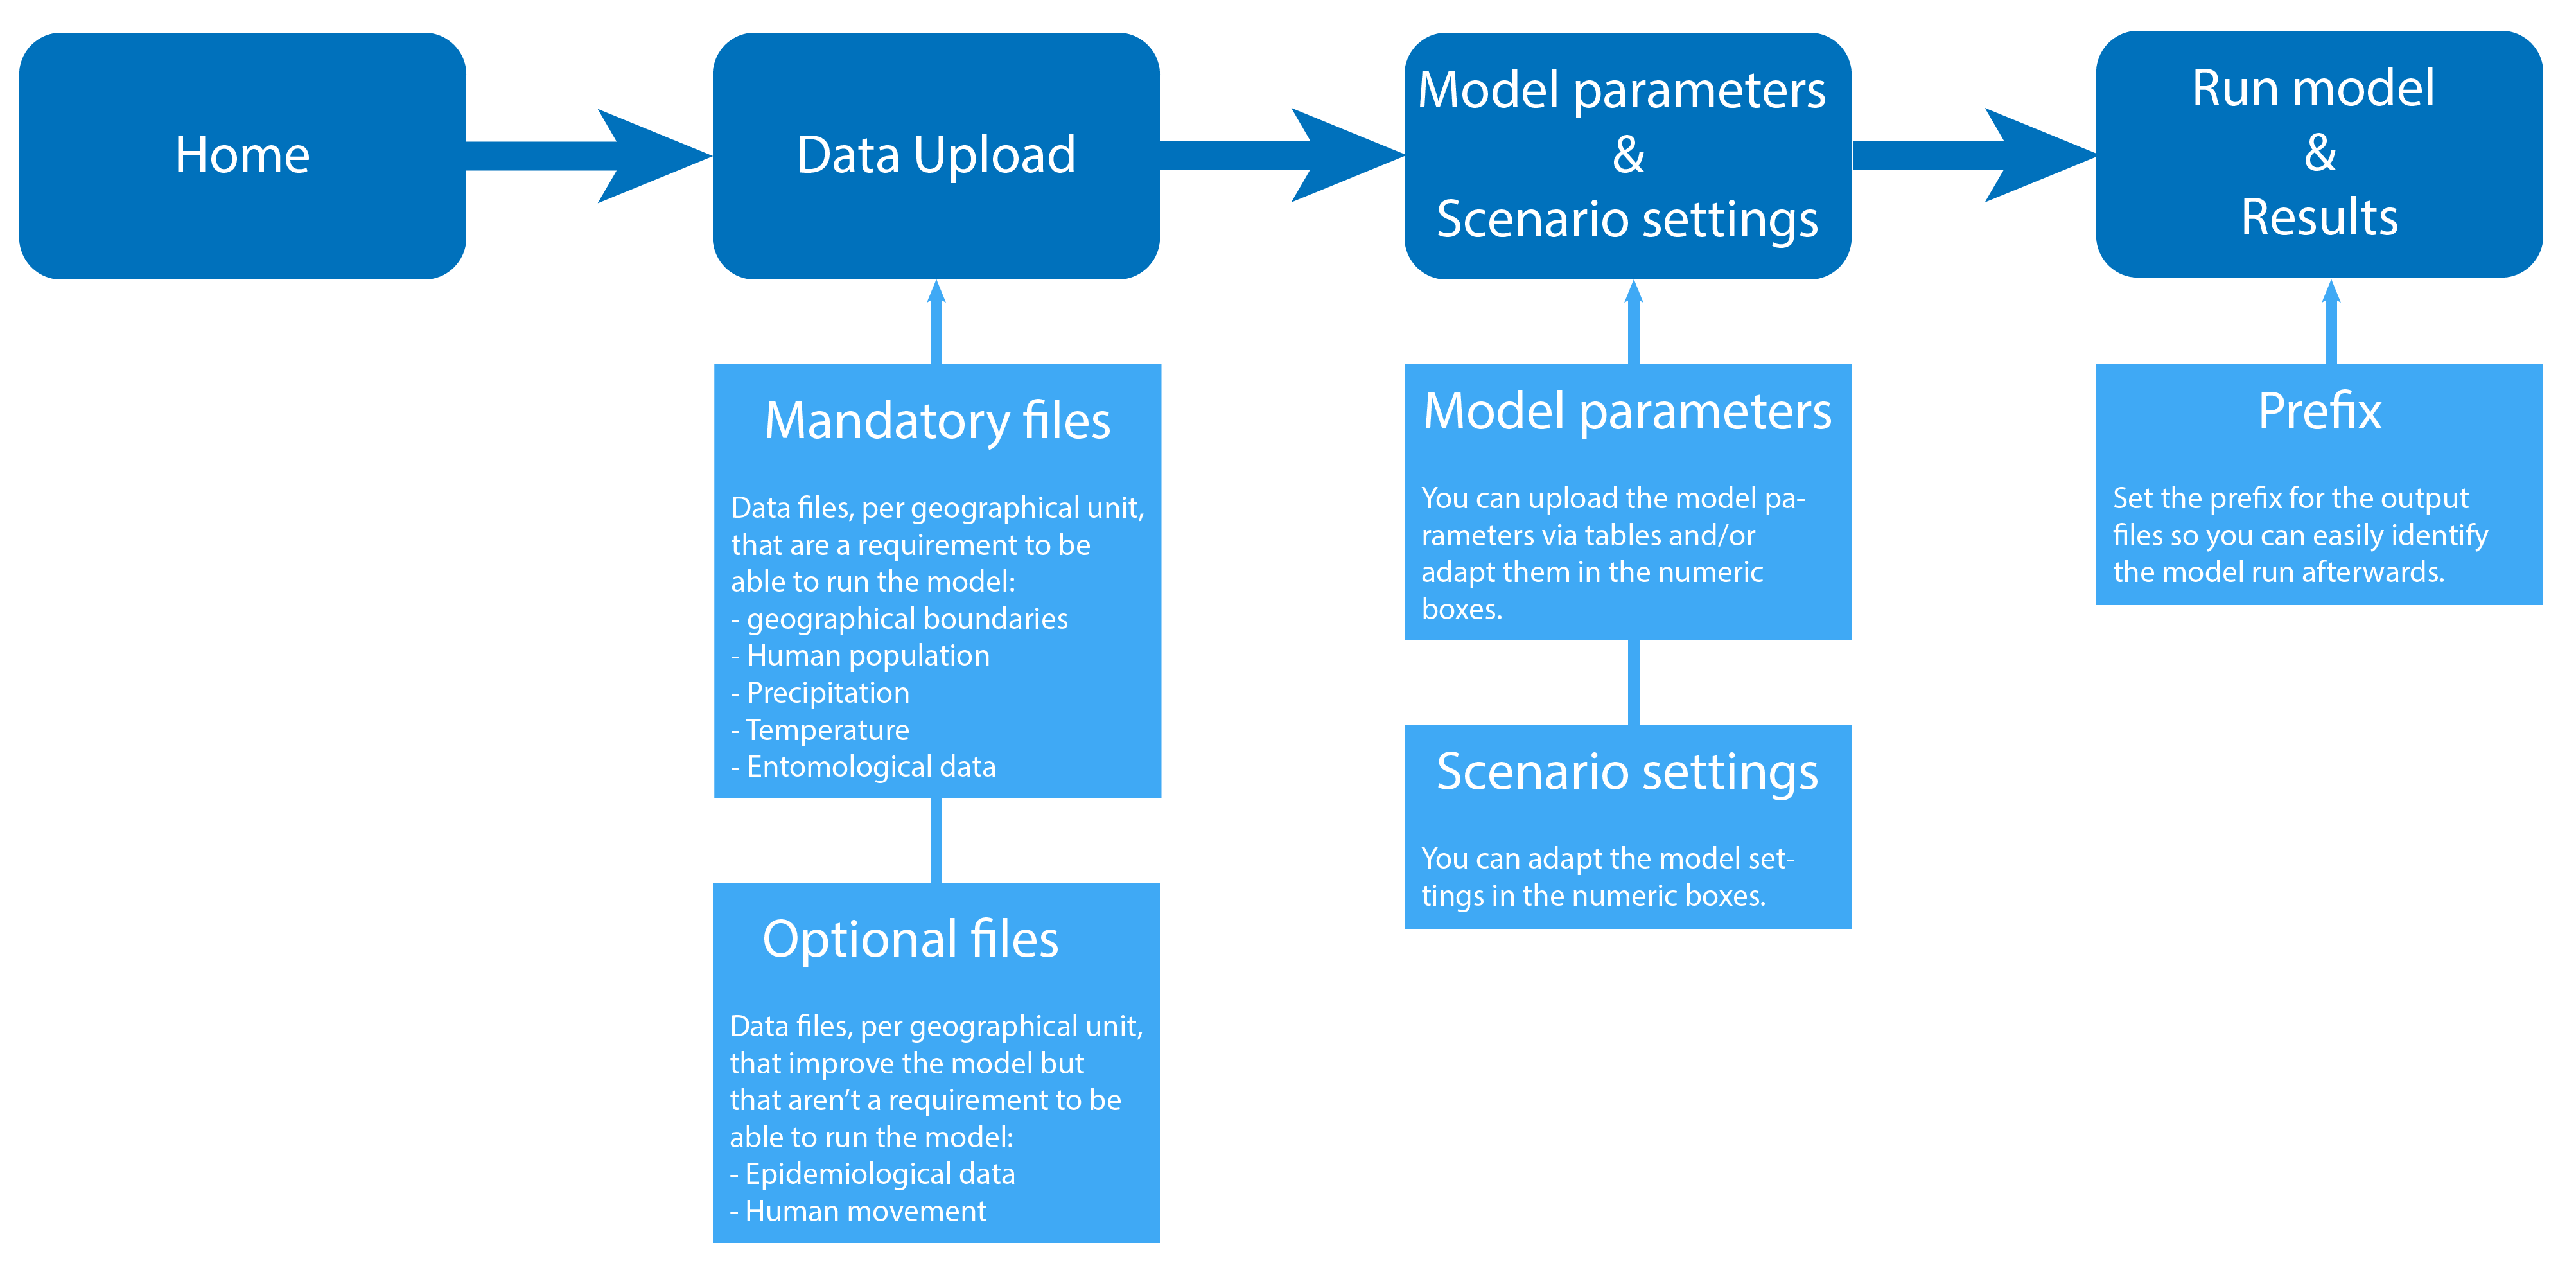
For a more detailed description please refer to the tool's manual.
Use a pre-defined scenario file (Optional)
This updates/overwrites those parameters and input files specified in the scenario file. Parameter values and input files may be updated/overwritten manually afterwards.
and / or
Mandatory files
or alternatively, upload a folder containing the boundary file(s).
This updates the number automatically. The folder must contain a shapefile with (with file extension .shp). A corresponding .shx file also has to be present in the same directory. During file upload the number of polygons will be determined and assigned patch numbers in the order of upload.
The file must be a 2-column tab-delimited or comma-delimited text file (with file extensions .dat or .csv) where the first column contains the ID number of the population (corresponding to the number of the patch characterized during the boundary file upload) and the second column the patch population size at initialization. The number of rows has to match the number of patches.
For simulations with burn-in years (see tab: Model parameters and scenario settings, section: Model settings), the precipitation file must be a 53-column (for weekly data) or 366-column (for daily data) tab-delimited or comma-delimited text file (with file extensions .dat or .csv), where the first column contains the ID number of the patch (corresponding to the patch number characterized during the boundary file upload) and the remaining columns representing the rainfall for each week or day during a year in millimeters, and one row for each patch present in the boundary file. For simulations without burn-in years, the number of columns may be different from 53 (for weekly) or 366 (for daily data)
For simulations with burn-in years (see tab: Model parameters and scenario settings, section: Model settings), the temperature file must be a 53-column (for weekly data) or 366-column (for daily data) tab-delimited or comma-delimited text file (with file extensions .dat or .csv), where the first column contains the ID number of the patch (corresponding to the patch number characterized during the boundary file upload) and the remaining columns representing the temperature for each week or day during a year in degrees Celsius, and one row for each patch present in the boundary file. For simulations without burn-in years, the number of columns may be different from 53 (for weekly) or 366 (for daily data)
The file must be a 3-column tab-delimited or comma-delimited text file (with file extensions .dat or .csv) where the first column contains the ID number of the patch (corresponding to the patch number of characterized during the boundary file upload), the second column the patch larval carrying capacity (number of larvae) and the third column the patch carrying capacity in number of pupae.
Optional files
The file must be a 3-column tab-delimited or comma-delimited text file (with file extensions .dat or .csv) where the first column contains the ID number of the patch (corresponding to the patch number characterized during the boundary file upload) and the second column the day of observation and the third column the number of cases observed during that within that population. The number of rows is unlimited, can be of any length and patch ID numbers may be repeated.
The file must be an n column by n rows tab-delimited or comma-delimited text file (with file extensions .dat or .csv) where n corresponds to the number of patches, the row and column numbers correspond to the ID numbers of the patches characterized during the boundary file upload. The matrix represents the movement of human between each pair of patches in the proportion of the population moving per day, with the patch from which movement takes place is indicated by the row number, and the recipient patch is indicated by the column number. Any numbers on the diagonal have no effect. Allowed values are between 0 and 1.
Mosquito parameters
Vector control intervention deployment
Virus parameters
This selects the temperature-dependent rate for development in the mosquito (1/(extrinsic incubation period)).In the current version, the rates are the same for dengue and chikungunya due to lack of data on chikungunya.
Health system
Model settings
If you want to simulate with optional burn-in years with mosquito dynamics (but without vector control or infections), choose a value >0. Note: for simulations with burn-in, both your precipitation and temperature data need to cover one full year (52 weeks or 365 days, for weekly or daily data, respectively)
Random Seed
If left empty, then the simulation will automatically get assigned a random seed (for each individual simulation run)
The seed will be used to generate the seeds of each individual simulation run.
The file must be a comma-delimited file with the following headers: 'iSimul','seed'The file must be n-row * 2-column, with n the number of simulations. The first column contains the number of the simulation and the second column contains the corresponding seed.